CLO Ratings
When a Collateralized Loan Obligation (CLO) is formed, a Nationally Recognized Statistical Rating Organization (NRSRO) such as Moody’s Investor Service (Moody’s), Standard and Poor’s (S&P) or Fitch Ratings provide an independent public assessment of the credit quality of the CLO’s financing.
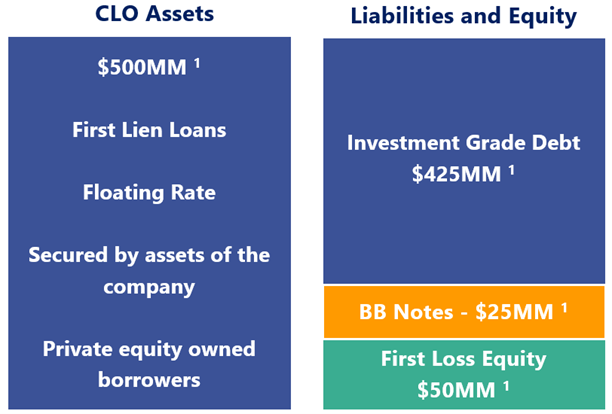
A typical CLO bundles together pools of first lien loans which are financed by issuing a series of debt notes (ranging in rating from AAA to BB) as well as an equity tranche that will absorb the first losses on the loans.
To rate a CLO’s debt notes, NRSROs consider the underlying ratings of the CLO’s loans, the likely recovery rate of the loans in a default, and how correlated any loan defaults in the CLO’s portfolio are likely to be.
The CLO’s underlying assets, first lien loans, are usually rated B using the S&P ratings scale or B2 using the Moody’s scale. Loan ratings are determined by fundamental factors of the business, such as: firm leverage, interest coverage, historical revenue and profitability growth, and the cyclicality of the business.
A BB rating from S&P, for example, has a qualitative description: “Less vulnerable in the near-term but faces major ongoing uncertainties to adverse business, financial and economic conditions.” A rating also corresponds to quantitative probabilities that the issuer will default over various time periods. The higher the rating, the lower the probability of default.
A portfolio of highly correlated loans presents greater risk to the CLO’s debt notes. As a result, CLOs are required to be highly diversified by issuer and industry category. The ratings process often includes a Monte-Carlo computer simulation model where thousands of potential scenarios of loan losses are modeled. From these simulations, a rating can be assigned.
BB CLOs Appear Structurally Underrated
NRSROs rate many different types of securities: loans, corporate bonds, government bonds, Commercial Mortgage-Backed Securities (CMBS), CLOs, etc. Each rating is standardized to reflect an assessment of credit quality meant to be comparable across all asset types. In other words, a BB rated CLO note should have the same credit quality as a BB rated corporate note.
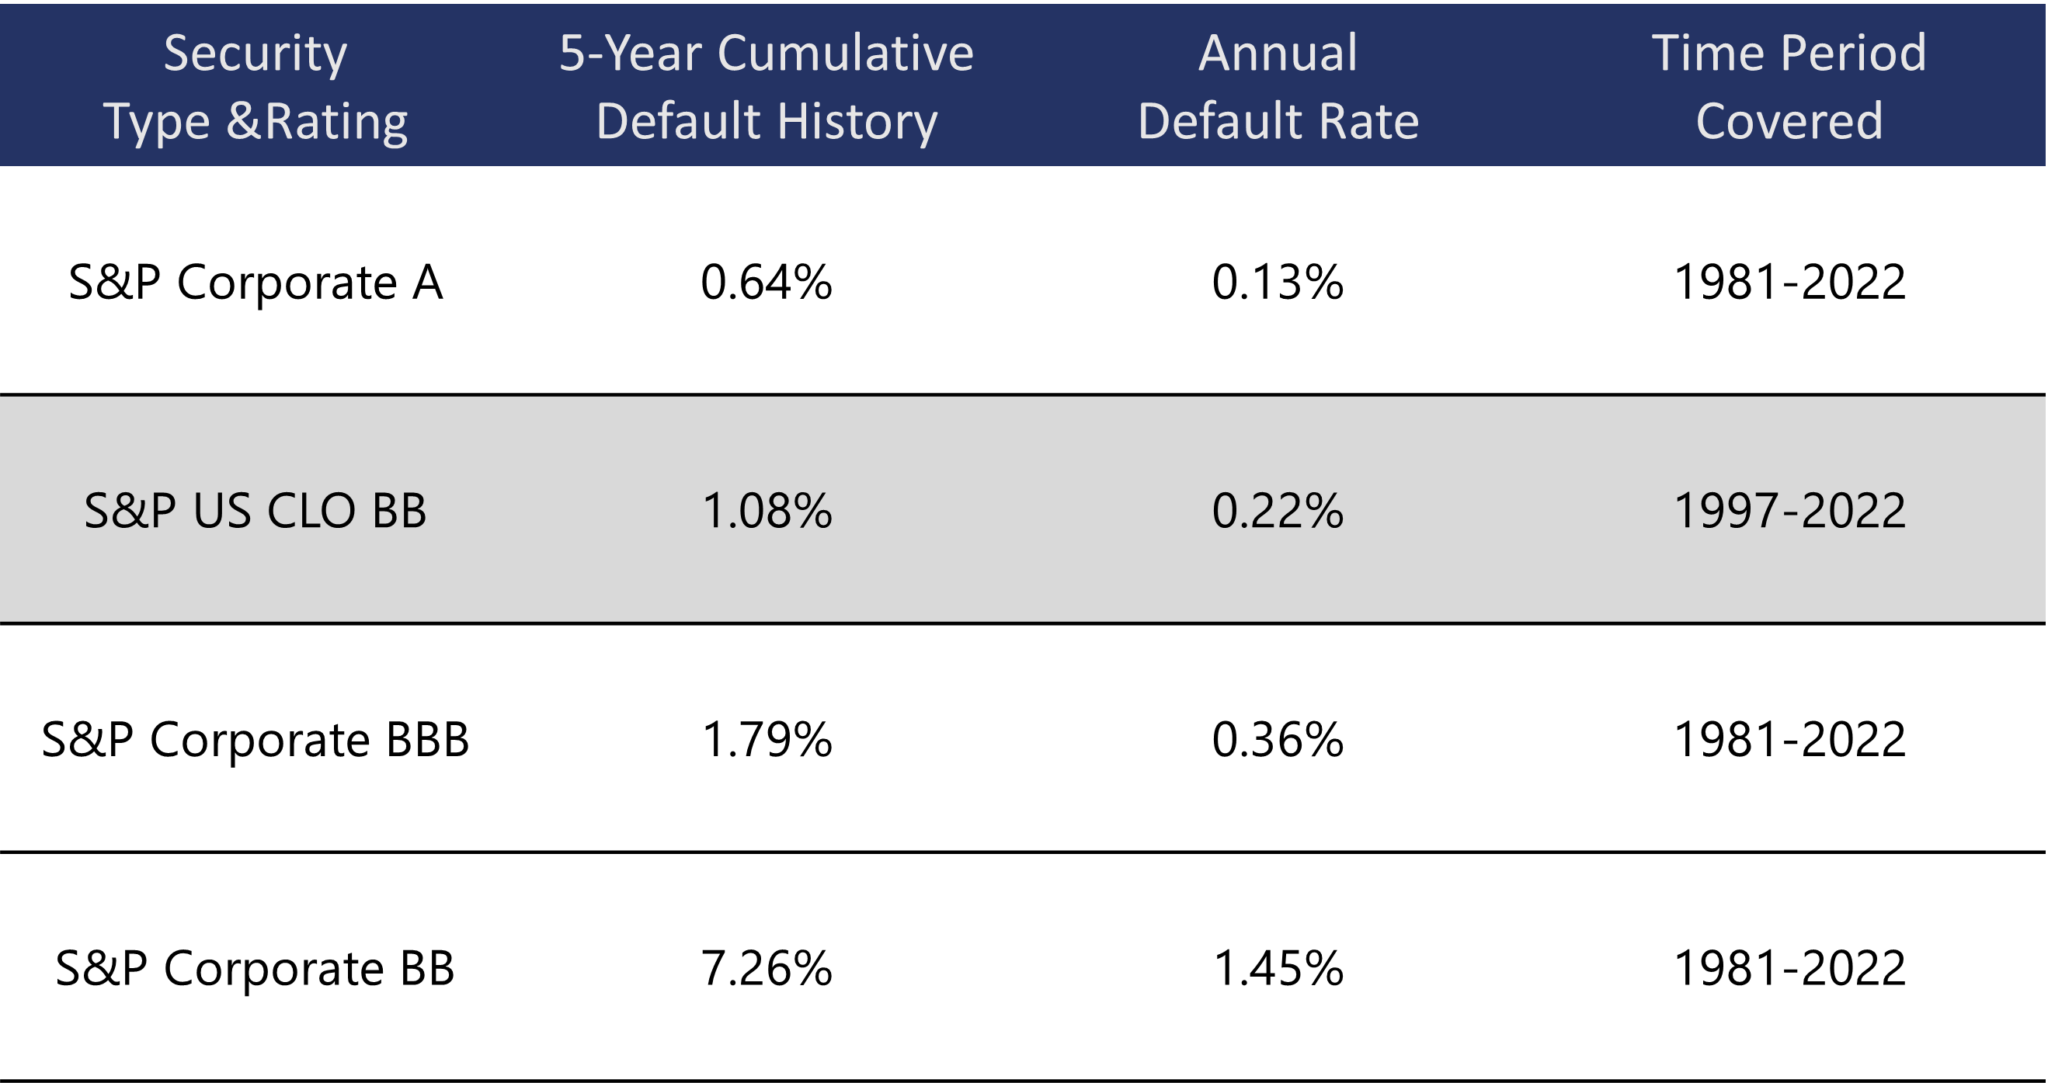
However, a comparative review of real-world default performance suggests that CLO securities are structurally underrated. CLO BB notes exhibit a 0.22% annualized default rate, which is significantly lower than the 1.45% annualized default rate for Corporate BB notes – by a factor of 6.6x! As shown below, CLO BBs have a default experience that is more similar to corporate credits rated investment grade (BBB or A).
However, a comparative review of real-world default performance suggests that CLO securities are structurally underrated. CLO BB notes exhibit a 0.22% annualized default rate, which is significantly lower than the 1.45% annualized default rate for Corporate BB notes – by a factor of 6.6x! As shown below, CLO BBs have a default experience that is more similar to corporate credits rated investment grade (BBB or A).
Potential Explanations for Rating Differentials
There are a few reasons why default probabilities may differ between corporates and CLOs. First, defaults in both corporates and CLOs are rare, so calibrating models with matching default probabilities for a given rating can be difficult. At any point in time, CLOs may be outperforming corporates or vice versa. Also, the data set for CLO securities begins in 1997, while the corporate data set begins in 1981.
Default differences may also be the result of today’s CLOs being associated with the failed Collateralized Debt Obligations (CDOs) from the Global Financial Crisis (GFC). While both securities are three letter acronyms beginning with ‘C’, they are very different: CLOs own highly diversified pools of actively managed senior secured loans, while CDOs’ assets were subprime mortgages of dubious credit quality. On a buy-and-hold basis, senior and junior CLO securities performed well through the GFC, while many CDOs saw defaults in securities initially rated AAA. Today’s CLOs have little in common with the CDOs of the past.
An additional potential explanation is that rating agencies do not give credit for the value that a CLO manager provides. Most CLO managers focus on loan portfolios that are more conservative than the overall loan market, and many CLO managers avoid loans that default.
Structural Protections for CLO BB Notes
The most important protection for the CLO BB Note is the initial equity contributed to the CLO, which takes the first losses on the loan portfolio.
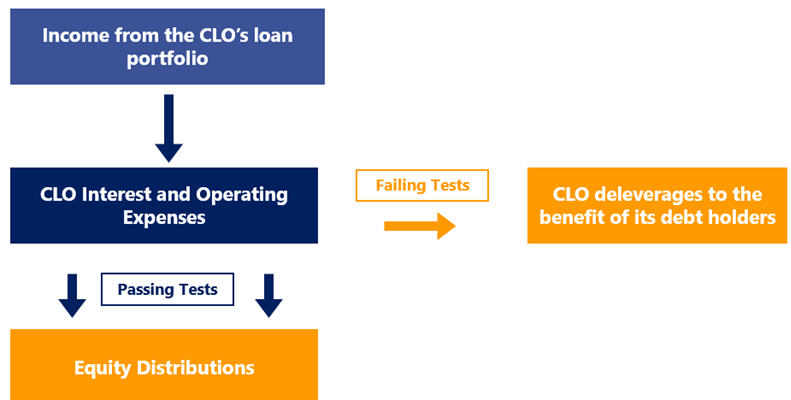
If a CLO loan portfolio underperforms (e.g., with too many defaulted loans or loans rated CCC), the CLO has structural protections that can redirect the CLO’s profitability to benefit the CLO’s noteholders. This diverted cash flow can be used to either buy more loans or delever the CLO; both of which results in an increased equity base in the CLO.
If a CLO loan portfolio underperforms (e.g., with too many defaulted loans or loans rated CCC), the CLO has structural protections that can redirect the CLO’s profitability to benefit the CLO’s noteholders. This diverted cash flow can be used to either buy more loans or delever the CLO; both of which results in an increased equity base in the CLO.
A key question for any investor in a CLO BB is: “What percent of the loans would need to default each year, such that the CLO BB noteholder does not receive all of his contractual interest and principal?” To perform this analysis, a projected recovery rate of the defaulted loans needs to be assumed. CLOs are typically modeled with a 70% recovery rate assumption, with a downside case recovery rate of 50%. The orange line in the graph below shows the actual default rate for the loan market, which peaked at 8% during the GFC and 5% during the COVID-downturn. The horizontal lines show the annual default rate required for the CLO BB to miss any contractual payments.
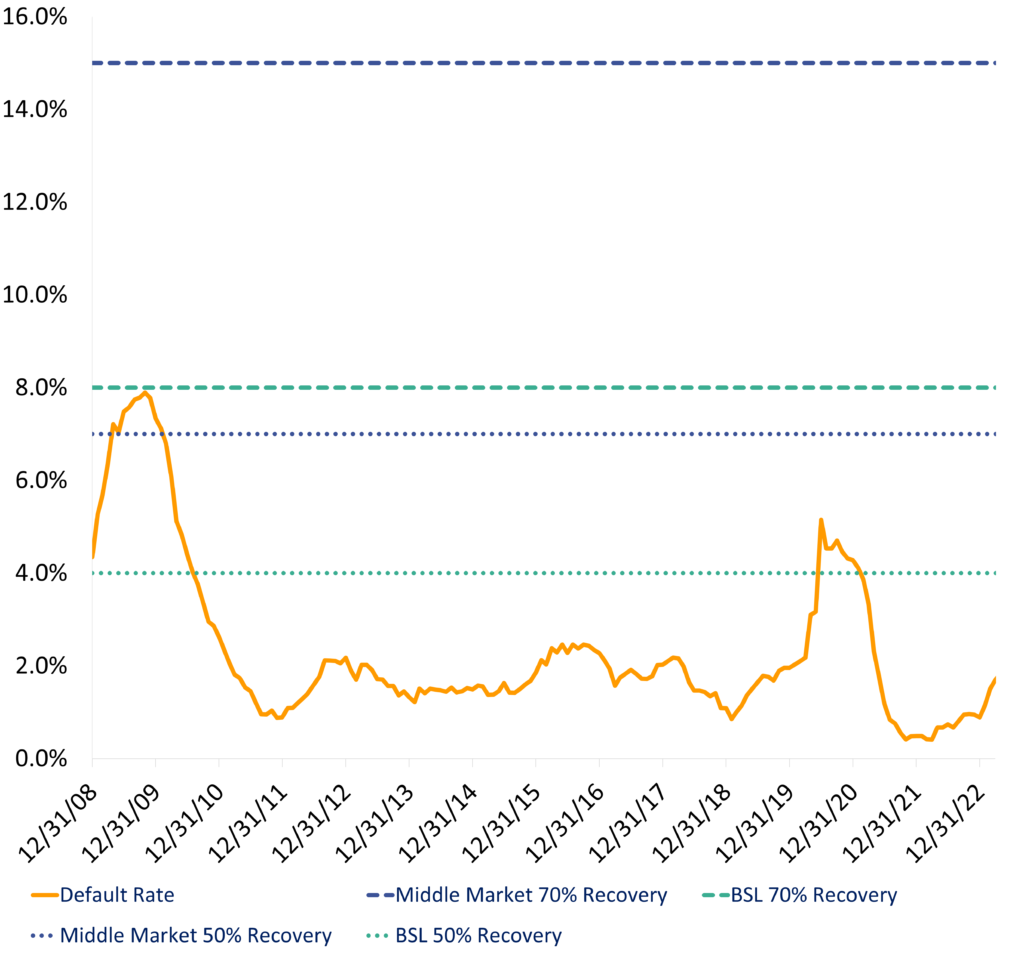
Middle market CLO BBs begin their lives with 12% equity and are therefore highly resilient to loan defaults. Assuming a 70% recovery rate, middle market CLO BBs would survive at almost 2.0x the default rate of the GFC and could withstand such an elevated default rate for a duration of nine years. For a broadly syndicated CLO BB with initial equity of 8%, the default rate required to impair the CLO BB falls to 8%.
Lower projected loan recoveries result in lower required loan default rates for CLO BB impairment. However, even at a 50% recovery rate, CLO BBs can withstand substantial defaults. The above analysis does not capture the power of the CLO’s “self-healing” mechanism. When default rates rise, CLOs in their reinvestment period benefit from being able to buy discounted loans in the market, which provides additional collateral for the CLO BB. The chart above assumes all new loans are bought at a price of 99, which would not be the case in recessionary environment.
Though not pictured in the graph above, the 0.22% default rate for CLO BBs would run almost on top of the x-axis, a sharp contrast to portfolios of loans and high yield bonds that have default rates of ~3% per annum. In short, the data suggests CLO BBs may have significant credit strengths that could correspond to higher ratings than they receive.
DISCLOSURES
Past performance is not indicative of future results. This is not an invitation to make any investment or purchase shares in any fund and is intended for informational purposes only.
Nothing contained herein constitutes investment, legal, tax or other advice, nor is it to be relied on in making an investment or other decision.
Nothing herein should be construed as a solicitation, offer or recommendation to acquire or dispose of any investment, or to engage in any other transaction.
For further information, please email info@flatrockglobal.com