As of 3/31/26
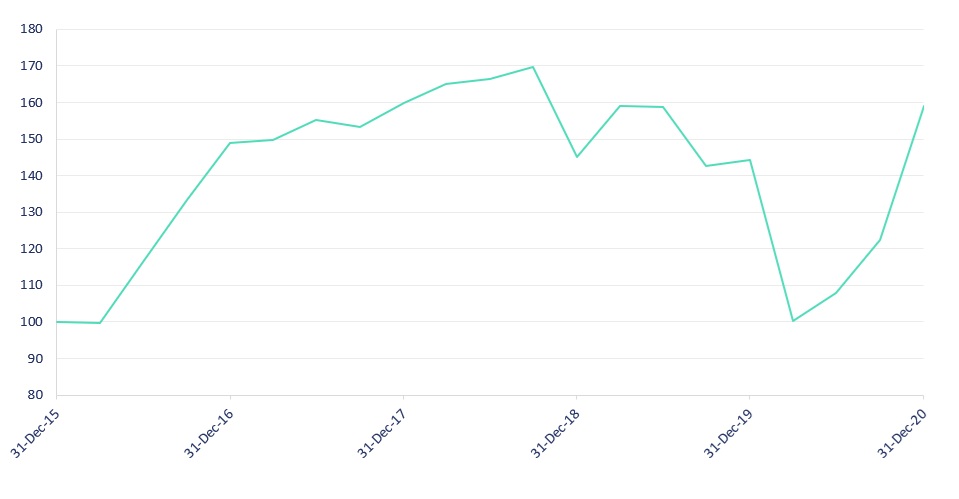
The Flat Rock CLO Equity Returns Index seeks to measure the unlevered, gross of fee performance of US CLO equity tranches as represented by the market-weighted performance of the underlying assets of funds that publicly disclose their holdings and fair market values to the U.S. Securities and Exchange commission. The reporting funds satisfy certain eligibility criteria. The index inception date is September 30, 2014. The index is calculated quarterly on a 75-day lag.
As of 3/31/26
No Data Found
Index Characteristics | 1Q2026 |
|---|---|
| CLO AUM at Fair Value | $3,965,175,777 |
| Number of CLOs | 793 |
| Number of firms providing marks | 7 |
One Year Return | Three Year Return Annualized | Five Year Return Annualized | Annualized Return since inception on 9/30/2014 | Maximum Quarterly Drawdown | Maximum Quarterly Drawdown Period | Standard Deviation of Returns |
|---|---|---|---|---|---|---|
| -17.4% | 3.0% | 3.3% | 4.8% | -30.4% | 1Q2020 | 19.2% |
| Date | Index Level | Quarterly Return | Yearly Return |
|---|---|---|---|
| 30-Sep-14 | 100.00 | ||
| 31-Dec-14 | 100.21 | 0.21% | |
| 31-Mar-15 | 101.02 | 0.80% | |
| 30-Jun-15 | 102.37 | 1.34% | |
| 30-Sep-15 | 94.71 | -7.48% | |
| 31-Dec-15 | 83.92 | -11.39% | -16.26% |
| 31-Mar-16 | 83.57 | -0.42% | |
| 30-Jun-16 | 97.59 | 16.78% | |
| 30-Sep-16 | 111.97 | 14.74% | |
| 31-Dec-16 | 124.88 | 11.53% | 48.81% |
| 31-Mar-17 | 125.64 | 0.61% | |
| 30-Jun-17 | 130.36 | 3.75% | |
| 30-Sep-17 | 128.54 | -1.39% | |
| 31-Dec-17 | 134.11 | 4.33% | 7.39% |
| 31-Mar-18 | 138.53 | 3.29% | |
| 30-Jun-18 | 139.59 | 0.77% | |
| 30-Sep-18 | 142.52 | 2.10% | |
| 31-Dec-18 | 121.72 | -14.59% | -9.24% |
| 31-Mar-19 | 133.55 | 9.72% | |
| 30-Jun-19 | 133.13 | -0.31% | |
| 30-Sep-19 | 119.74 | -10.06% | |
| 31-Dec-19 | 121.00 | 1.05% | -0.59% |
| 31-Mar-20 | 84.21 | -30.41% | |
| 30-Jun-20 | 90.61 | 7.60% | |
| 30-Sep-20 | 102.83 | 13.49% | |
| 31-Dec-20 | 133.57 | 29.89% | 10.39% |
| 31-Mar-21 | 145.65 | 9.04% | |
| 30-Jun-21 | 158.13 | 8.57% | |
| 30-Sep-21 | 170.45 | 7.79% | |
| 31-Dec-21 | 173.52 | 1.80% | 29.91% |
| 31-Mar-22 | 169.92 | -2.08% | |
| 30-Jun-22 | 148.71 | -12.48% | |
| 30-Sep-22 | 153.21 | 3.03% | |
| 31-Dec-22 | 153.34 | 0.09% | -11.63% |
| 31-Mar-23 | 157.09 | 2.44% | |
| 30-Jun-23 | 160.29 | 2.04% | |
| 30-Sep-23 | 177.12 | 10.49% | |
| 31-Dec-23 | 187.30 | 5.75% | 22.15% |
| 31-Mar-24 | 197.10 | 5.23% | |
| 30-Jun-24 | 204.30 | 3.66% | |
| 30-Sep-24 | 207.98 | 1.80% | |
| 31-Dec-24 | 218.36 | 4.99% | 16.58% |
| 31-Mar-25 | 207.55 | -4.95% | |
| 30-Jun-25 | 215.64 | 3.90% | |
| 30-Sep-25 | 216.31 | 0.31% | |
| 31-Dec-25 | 200.69 | -7.22% | -8.09% |
| 31-Mar-26 | 171.51 | -14.54% |