Laila Kollmorgen, Global Head of CLO Tranche Investing at MetLife Investment Management, joins The CLO Investor podcast to discuss her investment approach across the CLO capital structure and the products her team manages. Laila shares why she currently sees compelling opportunities in CLO equity, junior BBBs, and AAAs, while offering insights on software credit risk, AI disruption, private credit, and the evolving outlook for leveraged loans and CLOs.
Like & Subscribe: Amazon Music | Apple Podcasts | Spotify
18
Jun
2026
Are CLO BB Notes Misrated?
CLO Ratings
When a Collateralized Loan Obligation (CLO) is formed, a rating agency such as Moody’s Investors Service (Moody’s), Standard and Poor’s (S&P) or Fitch Ratings provides an independent public assessment of the credit quality of the CLO’s financing.
A typical CLO bundles together pools of first lien loans which are financed by issuing a series of debt notes (ranging in credit rating from AAA to BB) as well as an equity tranche that will absorb the first losses on the loans.

These are estimates of the size of broadly syndicated CLOs and can vary from CLO to CLO
To assign credit ratings to a CLO’s debt notes, rating agencies consider: 1) the underlying credit ratings of the CLO’s loans; 2) the likely recovery rate of the loans if they default; and 3) whether loan defaults in the CLO’s portfolio are likely to be correlated.
The CLO’s first lien loans are usually rated ‘B’ using the S&P credit ratings scale or ‘B2’ using the Moody’s scale. Individual loan ratings are determined by fundamental factors of the business, such as firm leverage, interest coverage, historical revenue and profitability growth, and the cyclicality of the business. A loan rated ‘BB’ by S&P, for example, is summarized qualitatively as: “Less vulnerable in the near-term but faces major ongoing uncertainties to adverse business, financial and economic conditions.” Each credit rating also corresponds to quantitative probabilities that the issuer will default over various time periods. The higher the rating, the lower the probability that the loan will default.
A portfolio of highly correlated loans presents greater risk to the CLO’s debt notes. As a result, CLOs are required to be highly diversified by issuer and industry category. The ratings process often includes a Monte-Carlo computer simulation where thousands of potential scenarios of loan losses are modeled. From these simulations, a rating can be assigned.
BB CLOs Appear Structurally Underrated
Rating agencies rate many different types of securities: loans, corporate bonds, government bonds, Commercial Mortgage-Backed Securities (CMBS), CLOs, etc. Each rating is standardized to reflect an assessment of credit quality meant to be comparable across all asset types. In other words, a CLO BB note should have the same credit quality as a ‘BB’ rated corporate bond.
However, a comparative review of real-world default performance suggests that CLO securities are structurally underrated. CLO BB notes exhibit a 0.22% annualized default rate, which is significantly lower than the 1.40% annualized default rate for Corporate BB notes — by a factor of 6.3x.
As shown below, CLO BBs have a default experience that is closer to corporate credits rated investment grade (‘BBB’ or ‘A’).
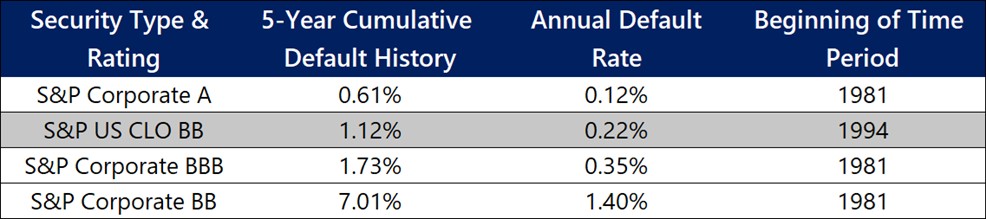
Source: Standard and Poor’s. The time periods correspond to the data sets provided by the agency.
Potential Explanations for Rating Differentials
There are a few reasons why default probabilities may differ between corporates and CLOs. First, defaults in both corporates and CLOs are rare, so calibrating models with matching default probabilities for a given rating can be difficult. At any point in time, CLOs may be outperforming corporates or vice versa. Also, the data set for CLO securities begins in 1994, while the corporate data set begins in 1981.
Default differences may also stem from the fact that today’s CLOs are often associated with the failed Collateralized Debt Obligations (CDOs) from the Global Financial Crisis (GFC). While both securities are three-letter acronyms beginning with ‘C,’ they are very different: CLOs own highly diversified pools of actively managed senior secured loans, while CDOs’ assets were subprime mortgages of dubious credit quality, and as a result many CDOs saw defaults even in securities initially rated AAA.
Following the GFC, rating agencies tightened their methodologies when assessing structured credit. CLO notes were required to include additional credit protections even though senior and junior CLO debt generally performed well on a buy-and-hold basis through the crisis.
The combination of already resilient structures and more conservative post-GFC rating standards strengthened the credit profile of modern CLOs.
An additional potential explanation is that rating agencies do not give credit for the value that a CLO manager provides. Most CLO managers focus on assembling loan portfolios that are more conservative than the overall loan market, and many CLO managers avoid loans that default.
Structural Protections for CLO BB Notes
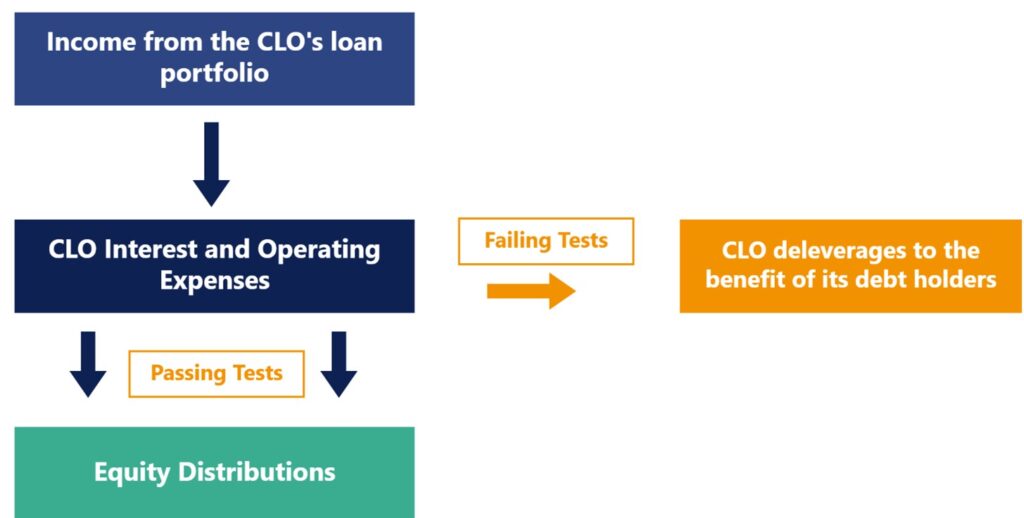
The most important protection for the CLO BB note is the initial equity contributed to the CLO, which takes the first losses on the loan portfolio.
If a loan portfolio underperforms (e.g., too many loans default or too many loans are downgraded to a CCC rating), the CLO has structural protections that can redirect the CLO’s profitability to benefit the noteholders. This diverted cash flow can be used to either buy more loans or de-lever the CLO, both of which result in increased credit protection for the CLO notes.
A key question for any investor in a CLO BB is: “What percent of the loans would need to default each year, such that the CLO BB noteholder does not receive all of their contractual interest and principal?” To perform this analysis, a projected recovery rate of the defaulted loans needs to be assumed. CLOs are typically modeled with a 70% recovery rate assumption, with a downside case recovery rate of 50%. The solid blue line in the graph below shows the actual default rate for the loan market, which peaked at 8% during the GFC. The dashed horizontal lines show the annual default rate required for the CLO BB to miss any contractual payments, assuming various recovery rates on the defaulted loans.

Source: Internal modeling using Intex, JP Morgan Default Monitor (April 2026). Results are from a hypothetical new-issue private credit CLO with a four-year reinvestment period and a hypothetical broadly syndicated CLO with a five-year reinvestment period. Assumes a pre-payment rate of 25%.
Private credit CLO BBs begin their lives with 12% equity and are highly resilient to loan defaults. Assuming a 70% recovery rate, private credit CLO BBs would survive 2.5x the default rate of the GFC and could withstand that elevated default rate for a duration of eight years. For a broadly syndicated CLO BB with initial equity of 8%, the default rate required to impair the CLO BB falls to 12%.
Lower projected loan recoveries result in lower required loan default rates for CLO BB impairment. However, even at a 50% recovery rate, CLO BBs can withstand substantial defaults.
Importantly, the above analysis does not capture the power of the CLO’s “self-healing” mechanism. When default rates rise, CLOs in their reinvestment period can benefit from their ability to buy discounted loans in the market, which provides additional collateral for the CLO BB. The chart above assumes all new loans are bought at a price of 99, which would be a conservative assumption in a recessionary environment.
Putting it All Together
As the chart below illustrates, CLO BBs default at 0.22% annually – a testament to the strong structural protections provided by the CLO structure. This default rate contrasts sharply with the annual default rates for high yield bonds and leveraged loans, which are 3.8% and 2.7%, respectively.
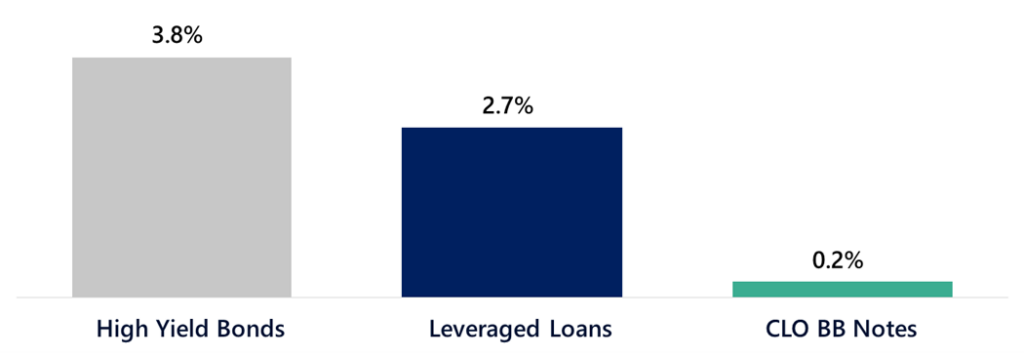
Source: High Yield Bond and Leveraged Loan annual default rates are 25-year average rates (including distressed exchanges) from JP Morgan Default Monitor (April 2026); CLO BB Default Rate is from S&P Global Ratings beginning 1994 and assumes a five-year average life. First lien loans, high yield bonds, and second lien loans are different in many respects including default rates, returns, and volatility. Past performance is not indicative of future results.
Although CLO BBs have historically experienced significantly lower default rates than high yield bonds and leveraged loans, they have generally offered investors a yield premium.
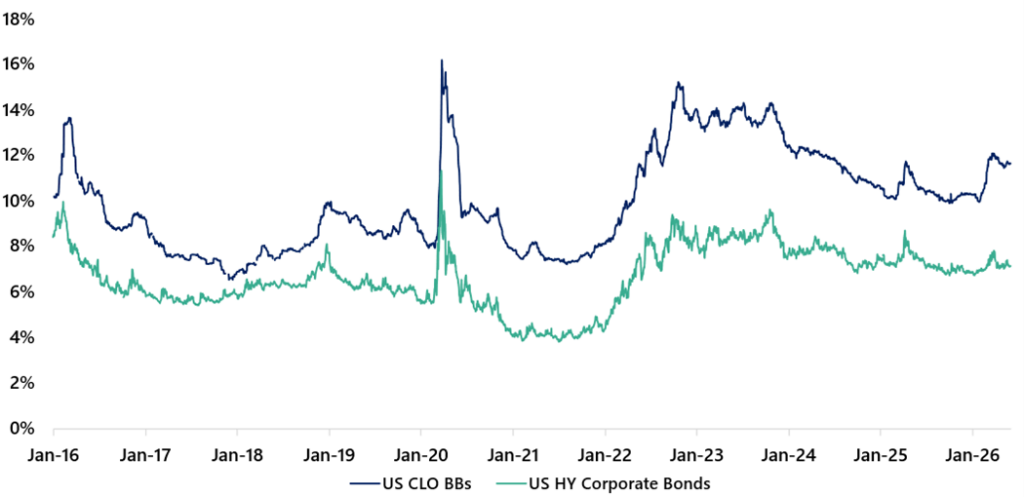
Source: US CLO BB yield is reported by Palmer Square CLO BB Yield index. US HY Corporate bonds is derived from the Yield function on Bloomberg for the iShares iBoxx USD High Yield Corporate Bond ETF.
We view this incremental yield as compensation for the illiquidity and complexity associated with the asset class, rather than a reflection of weaker underlying credit fundamentals.
DISCLOSURES
Past performance is not indicative of future results.
This is not an invitation to make any investment or purchase shares in any fund and is intended for informational purposes only. Nothing contained herein constitutes investment, legal, tax or other advice, nor is it to be relied on in making an investment or other decision. Nothing herein should be construed as a solicitation, offer or recommendation to acquire or dispose of any investment, or to engage in any other transaction.
For further information feel free to email info@flatrockglobal.com