As another volatile year concludes, it is with great humility and deep respect for the likelihood of the unexpected, the following are my top 10 Predictions for 2024:
1. While we will avoid a recession, GDP growth will slow significantly.
Real GDP growth for 2023 is expected to come in around 3%. I wouldn’t be surprised to see the effect of higher interest rates result in 2024 GDP growth of around 1%. Wall Street is mostly convinced that the Fed will reach its goal of a soft landing for the U.S. economy in 2024. This means there will be slower economic growth, but no recession, leading to interest rate cuts in 2024. Consider how close that leaves us to dipping into negative growth/recession territory if the Fed doesn’t manage interest rates carefully. Hedge your bets.
2. The S&P 500 will be up mid to high single-digits—let’s call it 5%.
The average Wall Street analyst remains constructive on U.S. equities, forecasting a ~5% total return on the S&P 500 in 2024. These forecasts reflect positive EPS growth and valuation assumptions, despite headwinds from a sluggish economy and uncertainty around the 2024 Presidential election. We view private credit as the relatively more attractive asset class.
3. Private equity returns will not be worth the lack of liquidity and drawdown hassle.
Higher rates have led to a shift in economics away from private equity to the benefit of private credit. Even BlackRock predicts only 11.2% returns for private equity over the next 10 years. Enough said.
4. Real estate investments warrant caution, as more pain is yet to come.
Commercial real estate incurred over half a trillion dollars in losses in 2023 and is projected to have similar losses again in 2024. Read the recent Muddy Waters Research report on Blackstone Mortgage Trust (BXMT) and the hair will stand up on the back of your neck. Of course, out of chaos can eventually come opportunity.
5. Private credit default rates will continue to trend in line with historical averages.
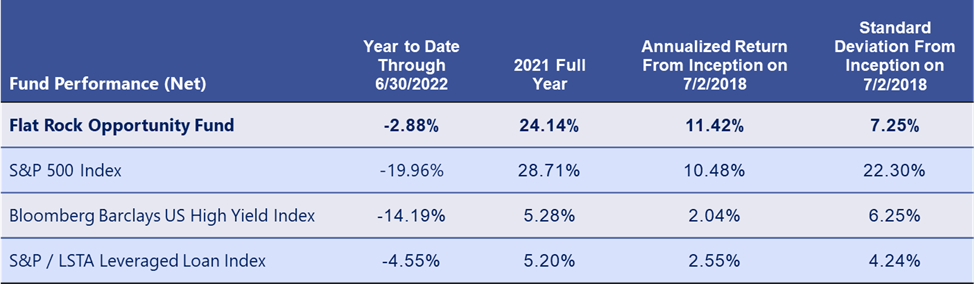
JP Morgan’s most recent forecast is for private credit default rates to average 3.25% in 2024. This represents a 75bp reduction in forecasted default levels from their previous prediction. The 25-year average default rates are 3.00%. I expect default rates to remain close to these historical averages. Interestingly, the loans in Flat Rock Opportunity Fund’s CLOs have defaulted at a 1.7% rate in 2023. Carefully curating your private credit exposure can make a significant difference in risk and return.
6. Grouping private credit risk into a monolithic bucket will be fraught with risk.
Private credit, now estimated to be in excess of a $1.5 trillion market, is as diverse in potential risk as bonds. First lien risk is radically different than second lien risk and certainly mezz debt or distressed debt. Loan-to-value is critical—the more equity that finances the business, the greater the margin of safety for the lender. According to JP Morgan Research, first lien loans have a recovery rate of 64.3% while second lien loans have a 23.9% recovery rate. That means even a small amount of second lien exposure has the potential to materially increase risk. Why expose yourself to anything except high quality, first lien, senior secured loans when they are currently generating equity-type returns?
7. Private credit will outperform the S&P 500, private equity, and real estate.
At the current interest rate levels, high quality, first lien loans are generating equity-type returns. Even if rates decline a bit, as economic growth slows, there is safety at the top of the capital stack.
8. Unique investment opportunities will be found in capacity-constrained strategies.
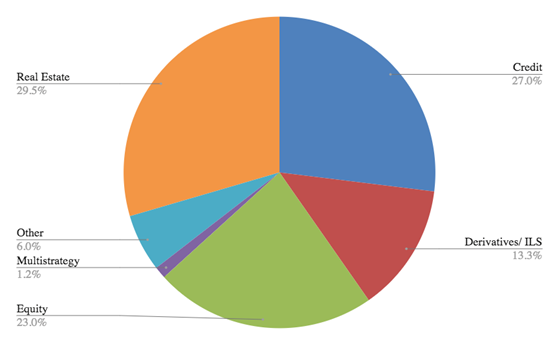
Consider CLO BB Notes, CLO Equity, lower middle market private credit, and one-off real estate transactions underwritten by quality firms. These market segments are too small for the behemoth asset managers.
9. Boys in the Boat will win the Oscar for Best Picture.
I read this book a few years ago and consider it one of the best books I’ve read. It’s the story of a Washington University crew team overcoming numerous obstacles to achieve an unbelievable level of success. The main message for me was the power of hard work combined with the power of teamwork can allow you to accomplish goals you never thought possible. I am immensely grateful for the hard work of the entire Flat Rock Global team and the power of teamwork they show every day.
10. The Eagles will win the Super Bowl.
Or it could be the 49ers, or the Chiefs; I like the Bills as a long shot, damn who knows, but our colleague Yuri is such a diehard Eagles fan I have to cheer for them. Go Birds!
SOURCES
1. Bureau of Economic Analysis; Bureau of Labor Statistics; Congressional Budget Office. December 2023.
2. 2023 Stock Market Year in Review. Forbes Advisor. December 4, 2023.
GLOSSARY
Basis point (bp): Refers to a common unit of measure for interest rates and other percentages in finance. One basis point is equal to 1/100th of 1%, or 0.01%, or 0.0001, and is used to denote the percentage change in a financial instrument.
Collateralized Loan Obligations (CLOs): Collateralized loan obligations (CLO) are securities that are backed by a pool of loans. In other words, CLOs are repackaged loans that are sold to investors.
First Lien Risk: First lien loans are first in line for payment in a bankruptcy, with a lien on all the company’s assets.
Second Lien Risk: Second lien loans are second in line for payment in a bankruptcy, and thus carry more risk than first lien loans.
Mezzanine (Mezz) Debt: Mezzanine debt is when a hybrid debt issue is subordinate to another debt issue from the same issuer.
Distressed Debt: Distressed debt is debt that belongs to government entities or companies that are facing financial difficulties, such as default.
Loan-to-Value: The loan-to-value ratio looks at the amount of money being borrowed and compares it to the market price of the asset being purchased.
Margin of Safety: The margin of safety principle of investing applies when an investor only buys securities when the market price is below the estimated intrinsic value.
BB Notes: BB Notes refers to debt notes with a rating of BB by a National Recognized Statistical Rating Organization (NRSRO) such as Moody’s Investor Service (Moody’s), Standard & Poor’s (S&P), or Fitch Ratings.
DISCLOSURES
Past performance is not indicative of future results. This is not an invitation to make any investment or purchase shares in any fund and is intended for informational purposes only.
Nothing contained herein constitutes investment, legal, tax or other advice, nor is it to be relied on in making an investment or other decision.
Nothing herein should be construed as a solicitation, offer or recommendation to acquire or dispose of any investment, or to engage in any other transaction.
About Flat Rock Opportunity Fund (FROPX):
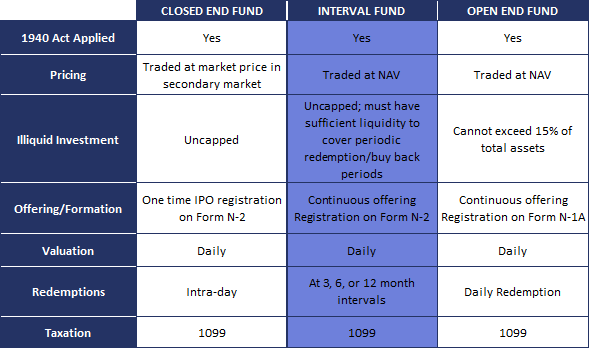
Flat Rock Opportunity Fund invests primarily in equity and in junior debt tranches of CLOs. CLOs provide exposure to senior secured loans on a leveraged basis. Flat Rock Opportunity Fund is structured as an SEC-registered closed-end management investment company operating as an interval fund, and shares of the Fund can be purchased using the ticker FROPX.
Consider the investment objectives, risks, charges and expenses of the Fund carefully before investing. Other information about the Fund may be obtained at flatrockglobal.com/flat-rock-opportunity-fund. This material must be preceded or accompanied by a prospectus.
ALPS Distributors, Inc. serves as our principal underwriter, within the meaning of the Investment Company Act of 1940, as amended, and will act as the distributor of our shares on a best efforts’ basis, subject to various conditions.
The following disclaimer relates The Flat Rock Opportunity Fund (FROPX). The Fund is suitable for investors who can bear the risks associated with the Fund’s limited liquidity and should be viewed as a longterm investment. There is no secondary market for the Fund’s shares, and it is not anticipated that a secondary market will develop. Thus, an investment in the Fund may not be suitable for investors who may need the money they invest in a specified timeframe. The shares of the Fund are not redeemable. Although the Fund will offer to repurchase at least 5% of outstanding shares on a quarterly basis in accordance with the Fund’s repurchase policy, the Fund will not be required to repurchase shares at a shareholder’s option nor will shares be exchangeable for units, interests or shares of any security. The Fund is not required to extend, and shareholders should not expect the Fund’s Board of Trustees to authorize, repurchase offers in excess of 5% of outstanding shares. Regardless of how the Fund performs, an investor may not be able to sell or otherwise liquidate his or her shares whenever such investor would prefer. The Fund’s distributions may be funded from unlimited amounts of offering proceeds or borrowings, which may constitute a return of capital and reduce the amount of capital available to the Fund for investment. Any capital returned to shareholders through distributions will be distributed after payment of fees and expenses. The amounts and timing of distributions that the Fund may pay, if any, is uncertain. A return of capital to shareholders is a return of a portion of their original investment in the Fund, thereby reducing the tax basis of their investment. As a result of such reduction in tax basis, shareholders maybe subject to tax in connection with the sale of Shares, even if such Shares are sold at a loss relative to the shareholder’s original investment. Shares are speculative and involve a high degree of risk, including the risk associated with belowinvestment grade securities and leverage.
For further information, please email info@flatrockglobal.com
ALPS Control Number FLT000397
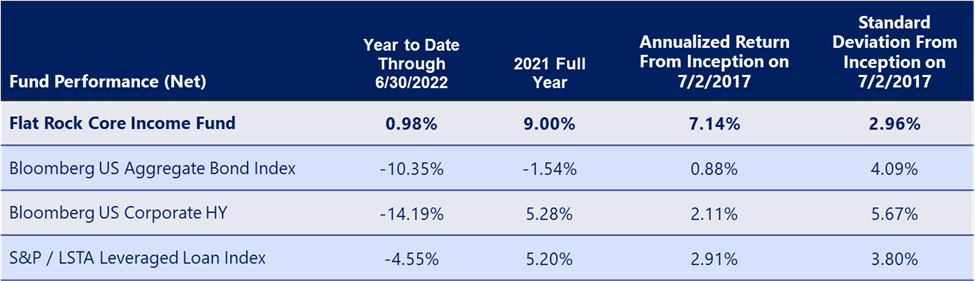 The performance data quoted here represents past performance. Current performance may be lower or higher than the performance quoted above. Investment return and principal value will fluctuate, so that shares, when redeemed, may be worth more or less than their original cost. Past performance is no guarantee of future results. Flat Rock Core Income Fund’s performance, especially for very short periods of time, should not be the sole factor in making your investment decisions. For performance data current to the most recent month end, please call 307.500.5200. All historical performance prior to 11/23/2020 is of the Predecessor Fund. Flat Rock Capital Corp. Flat Rock Core Income Fund is a fund with the same assets, Advisor, and investment strategy as the Predecessor Fund.